I have been exploring the Elastic Stack over the past few days, as a means of collecting and analysing data exported from edge machines.
The project is an on-premise solution on a highly secure network, so there is no possibility of making use of the cloud services offered by ElasticSearch, so to evaluate the solution, I needed to get my hands dirty and install Elastic stack.
This guide will walk through the process of installing the Elastic Stack on a fresh ubuntu server 16.04.
Install Java
ElasticSearch requires at least Java 8. For the purpose of this guide we'll install Oracle JDK Version 1.8.0_121 .
Check out Elasticsearch Reference [5.2] » Getting Started to find out more.
To install Java (if not already installed) first update your package index
Then we need to add Oracles PPA to our package repository
Now we can install the latest Java 8
Once installed we need to set the JAVA_HOME environment variable. This will be used later by both ElasticSearch and Kibana.
Open /etc/environment using nano text editor.
At the end of this file, add the following line, making sure you use the correct path in your environment.
Save and exit the file and then ensure it is reloaded
now test to ensure the environment variable has been set
Install ElasticSearch
We'll install elastic search using the Debian package. The instructions below are basically a trimmed down version of the instructions from Install ElasticSearch with Debian Package
Import the ElasticSearch PGP key
Installing from the APT repository
You may need to install the apt-transport-https package on Debian before proceeding:
Add the repository definition
We can now install ElasticSearch with the Debian package
Configure the daemon to run
We can now start and stop the service as required as follows
Install Kibana
update your package index then install Kibana, once complete check your Kibana configuration file
I didn't change anything in this file, but I just had a quick look through to familiarise myself with the settings available.
Enable the Kibana Service and start it.
Install Nginx
Kibana is packaged with its own webserver which by default is served on http://localhost:5601 , however because we are on an internet facing server, we need to configure a reverse proxy to allow external access to it. We'll need to install Nginx or apache as a web server. In my case I will be using Nginx.
Use apt to install Nginx
Use openssl to create an admin user, call it anything you want i.e. kibadmin, this will be the user that can access the Kibana web interface.
You'll be prompted to enter and confirm a password for this user.
Configure Nginx server block. First, backup the default server block and rename it then create a new file.
Then copy the following information into the file
Save and exit. This configures Nginx to direct your server's HTTP traffic to the Kibana application, which is listening on http://localhost:5601. Also, Nginx will use the htpasswd.users file, that we created earlier, and require basic authentication.
check the config for syntax errors and restart Nginx if none are found:

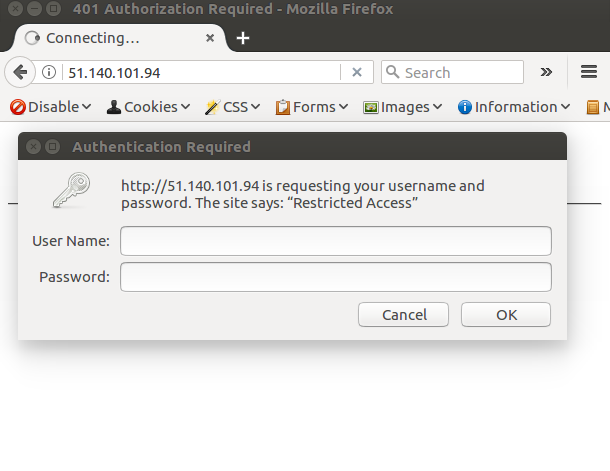
You should now be able to navigate to your website and and be prompted for the secure login
Install Logstash
Update the repository index again and install logstash
logstash is now installed but not yet configured.
Generate SSL certificates
We're going to use FileBeats to ship logs from our client servers to ElasticStack server, so we will need to create SSL certificate and key pairs. The certificate will be used by FileBeats to verify and identify the server.
Create the directories to store the certs and private keys
In my particular case I don't have DNS set up for my POC so I will be using IP address to resolve my server. So lets open the OpenSSL configuration file
Find the [ v3_ca ] section in the file, and add this line under it
Now generate the SSL certificate and private key in the appropriate locations (/etc/pki/tls/...), with the following commands:
The logstash-forwarder.crt file will be copied to all of the servers that will send logs to Logstash but we will do that a little later. Let's complete our Logstash configuration.
Configure Logstash
Logstash configuration files are in the JSON-format, and reside in /etc/logstash/conf.d. The configuration consists of three sections: inputs, filters, and outputs.
create a configuration file called 02-beats-input.conf and set up our "filebeat" input:
Insert the following input configuration:
Save and quit. This specifies a beats input that will listen on TCP port 5044, and it will use the SSL certificate and private key that we created earlier.
create a configuration file called 10-syslog-filter.conf, where we will add a filter for syslog messages:
Insert the following syslog filter configuration:
Save and quit. This filter looks for logs that are labeled as "syslog" type (by Filebeat), and it will try to use grok to parse incoming syslog logs to make it structured and query-able.
Lastly, we will create a configuration file called 30-elasticsearch-output.conf:
Save and exit. This output basically configures Logstash to store the beats data in Elasticsearch which is running at http://localhost:9200, in an index named after the beat used (filebeat, in our case).
- What is this Directory.Packages.props file all about? - January 25, 2024
- How to add Tailwind CSS to Blazor website - November 20, 2023
- How to deploy a Blazor site to Netlify - November 17, 2023