In implementing logging in .net core applications for logging, telemetry and your own sanity and Implementing logging with Serilog we devled a little deeper into the world of logging. Up until now we have been logging our our output to the console, which is great from an example point of view, but as developers we need to have and implement a more robust approach.
In this post, we are going to take a look at installing Seq and configuring our application to use Serilog to send our logs and use Seq to review our log details
What is Seq
Seq is the intelligent search, analysis, and alerting server built specifically for modern structured log data. You can use it to create the visibility you need to quickly identify and diagnose problems in complex applications and microservices.
Although Seq is requires a payment to use in production environment it is free to use locally and in production for single user license. Checkout Seq licence details
Seq is built for modern structured logging with message templates. Rather than waste time and effort trying to extract data from plain-text logs with fragile log parsing, the properties associated with each log event are captured and sent to Seq in a clean JSON format. Message templates are supported natively by ASP.NET Core, Serilog and many other libraries, so your application can use the best available diagnostic logging for your platform.
Seq accepts logs via HTTP, GELF, custom inputs, and the seqcli command-line client, with plug-ins or integrations available for .NET Core, Java, Node.js, Python, Ruby, Go, Docker, message queues, and many other technologies.
Seq makes it easy to find errors and performance issues with its fast search and filtering abilities.
There are number of ways you can search in Seq. You can do a text search by just typing in the search box which will search the log title for a particular text.
Getting started with Seq
Lets get started with using Seq, so we can actually start seeing all the bells and whistles it provides for ourselves.
Fortunately getting started with Seq is really easy thanks to Docker. If you haven't got Docker setup on your Ubuntu Linux desktop check out Install Docker on ubuntu for developers .
The official image for Seq is freely available over on Docker Hub. Using this image you can either get the image running using the docker pull and run commands.
Or if you prefer using docker compose, you can create a docker-compose.yml and paste the code below
Configure the application to ship logs to Seq
In Implementing logging with Serilog we configured our sample application to make use of Serilog to enable request logging, we're going to build on implementation to enable shipping our logs to Seq.
We will need to add some additional packages to our project.
We now need to simply edit our appsettings.Development.json to use these libraries
finally we need to make another amendment to the file and Seq configuration to the WriteTo array.
We can now run our application, possibly execute a couple of endpoints. We can then open our browser and navigate to http://localhost

Now that we Seq up and running, we can now focus on the detail that our logging provides.
Reviewing Logs in Seq
In Implementing logging with Serilog we configured our logging to print out the console and we formatted the output template string to {Timestamp:HH:mm:ss.fff zzz} [{Level}] [{SourceContext}] {Message}{NewLine}{Exception} which formatted our string neatly on the console, but it also hid a lot of the detail and benefit of using Serilog and the Request Logging it provides out of the box. Fortunately now with Seq, we can now view all that data now.
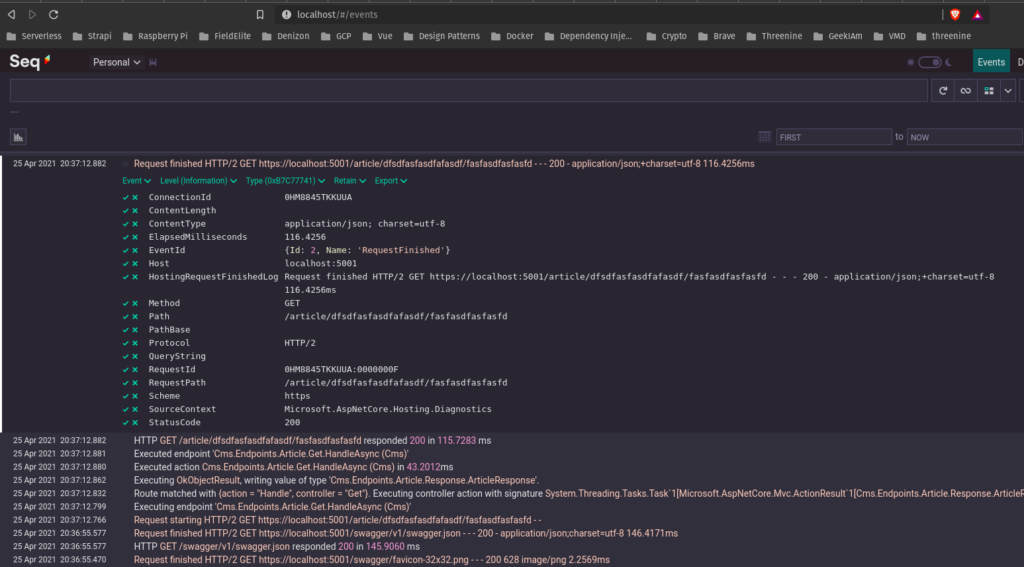
If we execute a request on our API project, in this case, its a simple Get request, then find and view the log entries for the request, 8 Entries detailing each step of the request pipeline

If we drill down into the step we can now clearly see the level of detail the entry provides.

There is quite a data that has been provided for us out the box, with Serilog request logging and we haven't even started to configure it! Even in this short sample there is a lot of actionable data we can derive about our application
There are a few things to note about the data provided:
- It includes most of relevant information you'd want in a single message - HTTP method, URL Path, Status Code, duration.
- The duration in milliseconds of each step.
- RequestId and SpanId (tracing capabilities) are logged as they are part of the logging scope
We can still add more information as and when required. I will detail how to do this in a future post.
Conclusion
If you've followed this series so far, you may recall in the first post Implementing logging in .net core applications for logging, telemetry and your own sanity how I really appreciate logging in my applications but I really hate the cyclomatic complexity and spaghetti-fication weaving logging statements into your code. As you can tell making use of Serilog and the Request Middle ware, this has greatly been reduced and we have really increased the level of logging in our application with just a few configuration options.
From this point we can either increase the amount of data we would like to capture in our logs or even reduce it. So changes may just require some configuration changes and some may just require some additional middleware to be developed but in either case we won't necessarily need to pollute our code with any logging statements.
In future articles I will discuss how all this can be achieved to introduce a robust and comprehensive logging strategy for your application.
- What is this Directory.Packages.props file all about? - January 25, 2024
- How to add Tailwind CSS to Blazor website - November 20, 2023
- How to deploy a Blazor site to Netlify - November 17, 2023
